.
Summary
The Michigan survey of consumers’ numerical series for expected inflation series starting in 1978 is intensively used and easily accessible from FRED. Less appreciated is that the same survey asked about expected inflation for much longer: qualitatively (up/down/same) since 1948 and in bins since 1966. This page makes these data available, as well as simple quantitative measures derived fomr them. The data was collated from public sources, so it can be freely used by other researchers. The dataset was posted in August of 2024, and will not be updated.
Authors and References:
Losing the Inflation Anchor (2022). Brookings Papers on Economic Activity 307-361, Fall. bibtex
Disagreement About Inflation Expectations (2004). NBER Macroeconomics Annual 18, 209-248. bibtex
Full Datasets
Quantitative measures 1966q2 - 1976q4
Qualitative measures 1948q1 - 1977q4
Variables
The data is at the quarterly frequency.
Quantitative data
| Column | Description |
|---|---|
date |
Year / quarter |
qual_up |
Percentage expecting prices to rise |
qual_down |
Percentage expecting prices to fall |
qual_same |
Percentage expecting no price change |
mrw_mean |
Mankiw-Reis-Wolfers Michigan series of mean expected inflation |
mrw_sd |
Mankiw-Reis-Wolfers Michigan series of standard deviation of expected inflation |
mrw_iqr |
Mankiw-Reis-Wolfers Michigan series of iqr of expected inflation |
reis_mean |
Reis Michigan series of mean of expected inflation |
reis_sd |
Reis Michigan series of standard deviation of expected inflation |
reis_skew |
Reis Michigan series of skewness of expected inflation |
Qualitative data
| Column | Description |
|---|---|
date |
Year / quarter |
downorsame |
Percentage expecting prices to fall or stay same |
inf_1to2 |
Percentage expecting prices to rise by 1-2% |
inf_3to4 |
Percentage expecting prices to rise by 3-4% |
inf_5 |
Percentage expecting prices to rise by 5% |
inf_6to9 |
Percentage expecting prices to rise by 6-9% |
inf_10to14 |
Percentage expecting prices to rise by 10-14% |
dontknowup |
Percentage who don't know how much prices will rise |
dontknow |
Percentage who don't know if prices will fall |
reis_mean |
Reis Michigan series of mean of expected inflation |
reis_sd |
Reis Michigan series of standard deviation of expected inflation |
reis_skew |
Reis Michigan series of skewness of expected inflation |
Figures
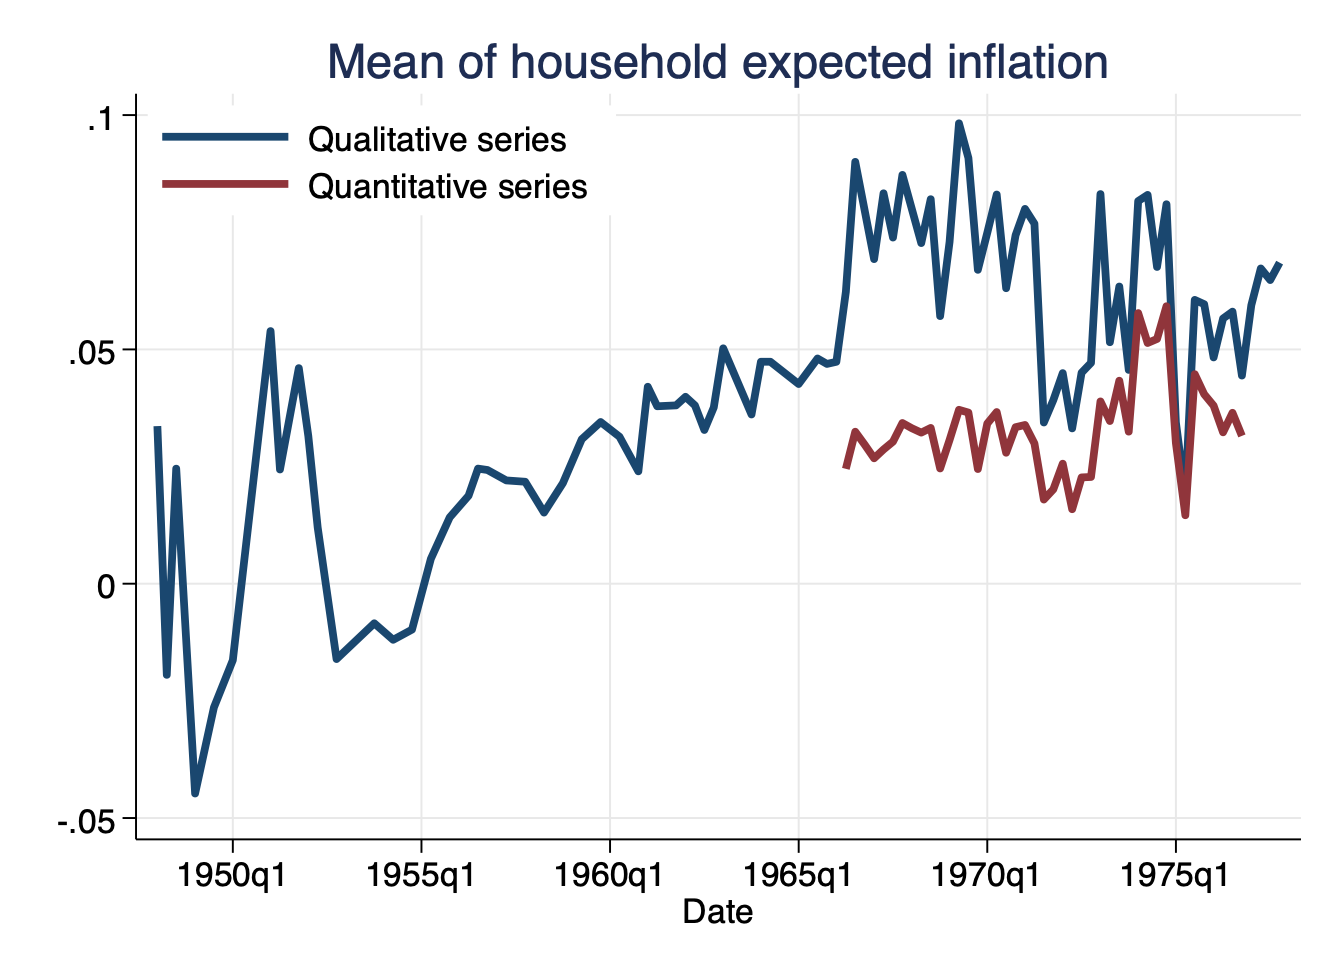
Qualitative and quantitative mean expected inflation by households

Data for replication: Excel, csv, dta
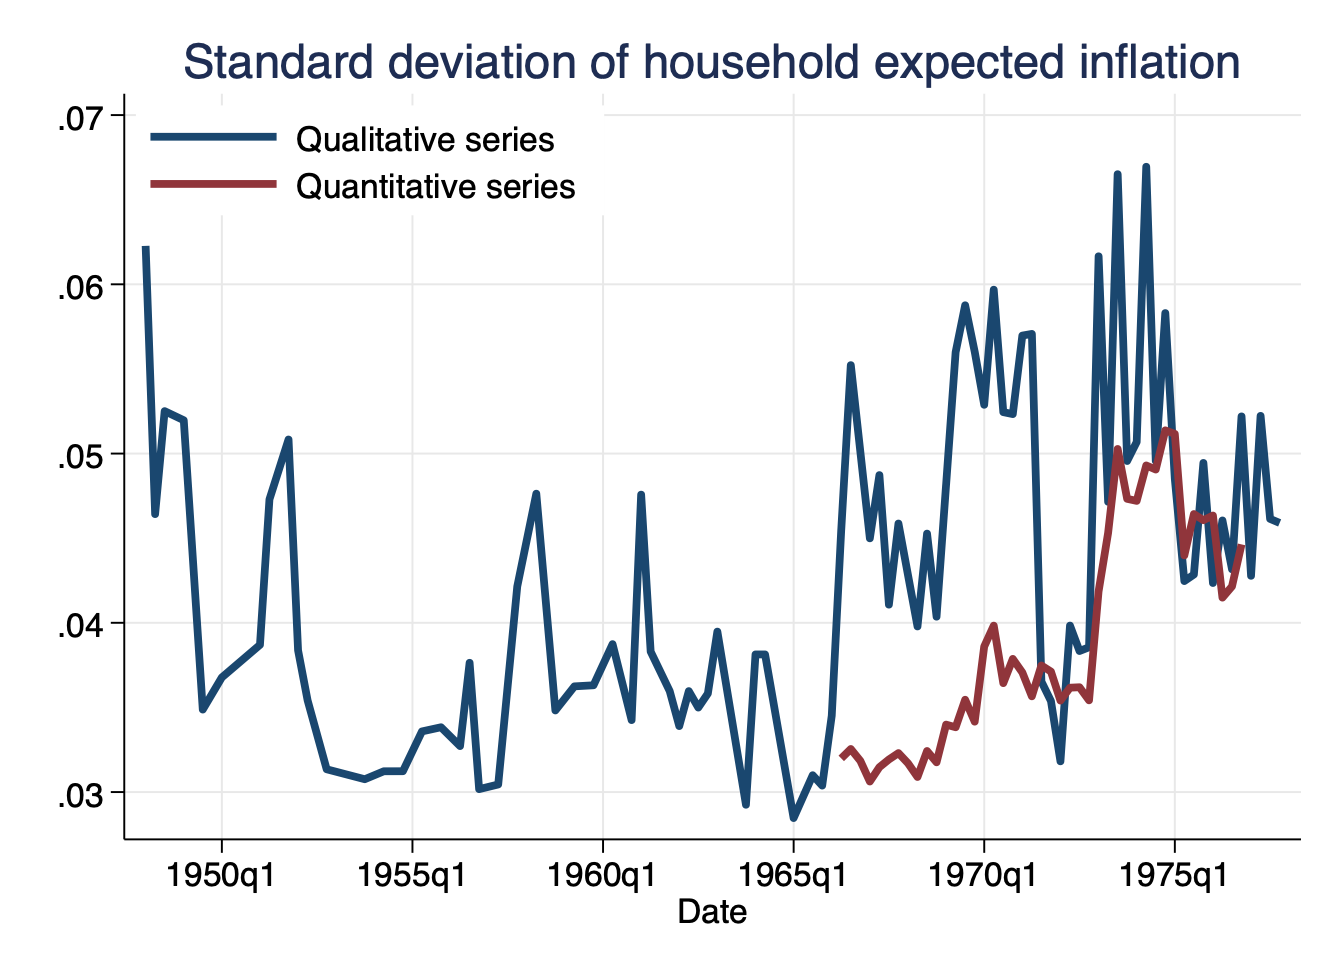
Qualitative and quantitative disagreement about expected inflation by households

Data for replication: Excel, csv, dta
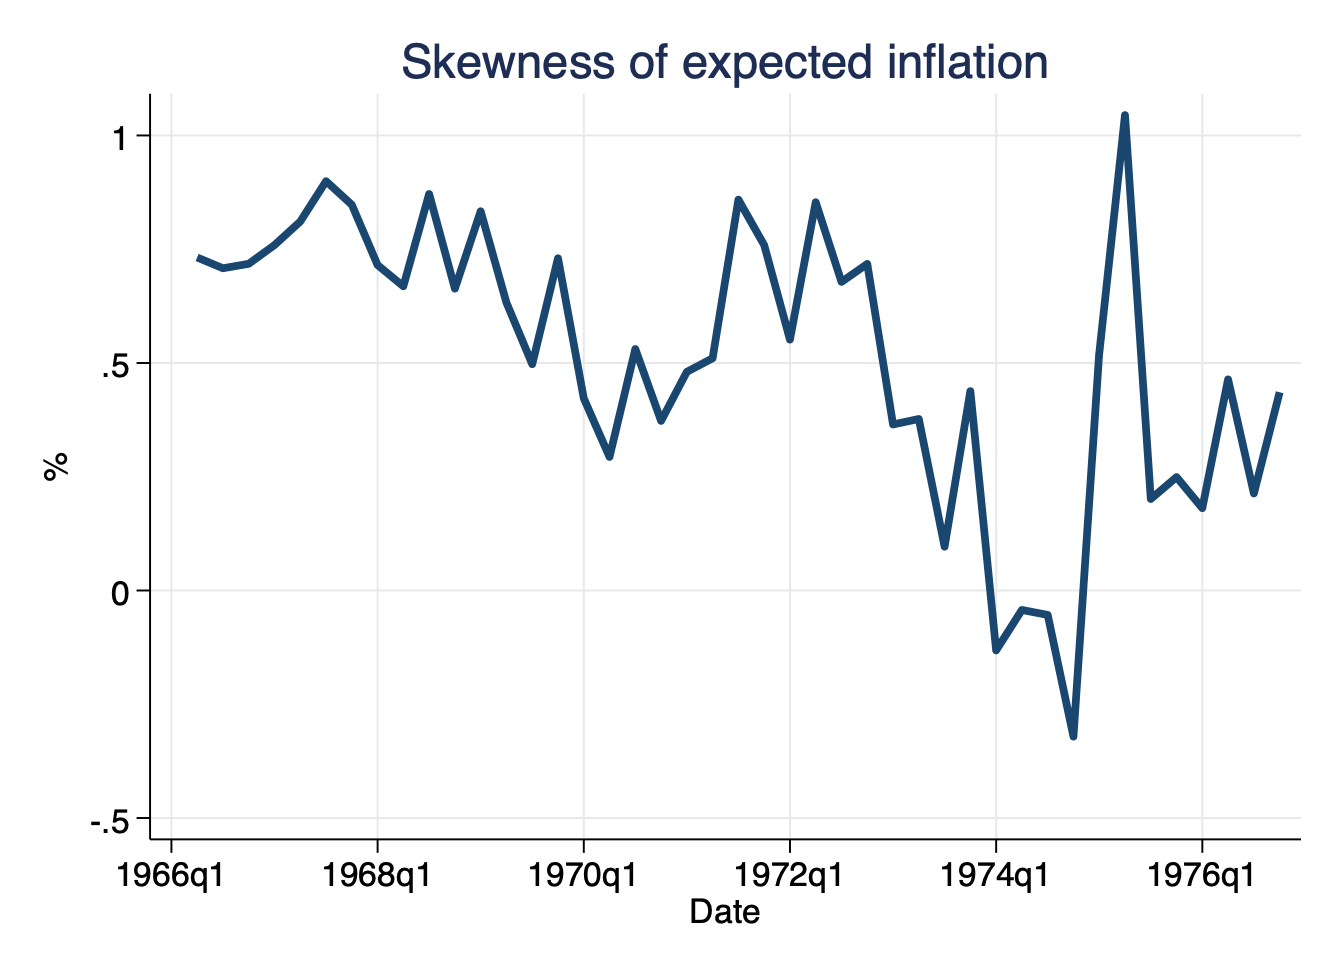
Quantitative disagreement about expected inflation by households

Data for replication: Excel, csv, dta
Usage
Please cite if use, and e-mail the authors with suggested corrections.